Buildings.sg Documentation
About the Project
Buildings.sg is an open, interactive platform developed by the City Syntax Lab at the National University of Singapore (NUS) for urban building energy modeling (UBEM) and carbon emissions analysis in Singapore. The platform integrates spatial data with operational and embodied carbon simulations, supported by a comprehensive set of open-source EnergyPlus templates for typical building archetypes in Singapore.
Users can download and customize these EnergyPlus templates for detailed simulations. Buildings.sg enables visualization and analysis of building-level carbon footprints, facilitating identification of energy efficiency improvements and carbon reduction opportunities. The platform supports Singapore’s Green Plan 2030 by promoting energy-efficient designs, sustainable materials, and low-carbon construction practices. Designed to be scalable and adaptable, Buildings.sg can be deployed in any city or municipality with available building and climate data.
Building Archetypes
Singapore's buildings are classified into residential and non-residential categories, further divided into seven Building Subtypes and 23 Building Archetypes, forming a comprehensive three-tier system. This framework is specifically optimized to support accurate simulation of building carbon emissions in Singapore. For detailed information about each subtype and archetype, please refer to the Archetypes section of the map.
Operational Carbon Simulation
Operational carbon represents emissions arising from a building's daily energy consumption, including cooling, lighting, equipment, and heating systems. We adopt an Urban Building Energy Modeling (UBEM) approach, a city-scale shoebox-based methodology that simulates energy performance across the built environment. This analytical framework allows evaluation of multiple scenarios to identify effective carbon reduction strategies and improve energy efficiency.
Embodied Carbon Simulation
Embodied carbon accounts for emissions associated with building materials and construction throughout the building's lifecycle. While full life cycle assessments (LCA) consider multiple stages, this project focuses on emissions from raw material extraction, transportation, manufacturing, and construction (stages A1–A5, known as "cradle to practical completion"). Due to limited data and inherent uncertainties, a probabilistic calculation method is used. Results are presented as probability distributions rather than single values, reflecting uncertainty and enabling effective risk assessment.
Project Structure
    index.html          – Main entry point that loads and initializes the web application.
    documentation.html  – Documentationation for project pipelines and user guidance.
    data/               – GeoJSON, and spreadsheets supporting charts and analysis.
    download/           – EnergyPlus IDF templates, DesignBuilder files, and map data.
    image/              – Archetype illustration images for interface visualization.
    logo/               – Icons and branding graphics displayed across the site.
    mapbox.js           – Initializes and styles the interactive map using Mapbox GL JS.
    panel.js            – Manages UI panels, controls, and filtering logic.
    popup.js            – Generates informational popups for Data and About sections.
Main Features
The platform offers a range of interactive tools designed to support urban-scale building performance analysis and decision-making:
- Multi-layer 3D visualization of building archetypes, embodied and operational carbon, and Green Mark attributes.
- Archetype-based filtering to explore detailed simulation methods, parameters, and results.
- Interactive building-level information: click any building to view energy use, carbon emissions, and key metrics.
- Integration of Singapore’s Master Plan 2019 land use with 3D zoning layers for urban planning analysis.
- Toggle machine-learning–derived building parameters to explore scenario variations.
- Download GeoJSON map data and EnergyPlus IDF templates for selected archetypes to support external modeling.
- Minimal dependencies and no complex frameworks, providing easy maintenance, extensibility, and adaptation to other regions.
Version Information
Platform Version: 1.0 Status:Active
Building Dataset Version: 5.0 Last Updated: 2025-11-15
Energy Simulation
Version: 5.0 Last Updated: 2025-6-18
Embodied Carbon Simulation
Version: 3.0 Last Updated: 2025-6-11
Data
Data Resource
Buildings.sg Dataset
Buildings.sg provides an integrated urban-to-building-level dataset covering Singapore. Sources include:
- OpenStreetMap (OSM): Building footprints and heights. https://overpass-turbo.eu/
- HDB & BCA: Public housing details and Green Mark certification data. https://github.com/ualsg/hdb3d-data https://www1.bca.gov.sg/buildsg/sustainability
- URA: Master Plan 2019 land-use zoning and planning annotations. https://data.gov.sg/collections/2104/view
- Machine Learning–Predicted Archetypes: Fill missing building archetypes.
- Simulated Carbon Metrics: Embodied and operational carbon modeled per building.
The data is provided in unified GeoJSON format and visualized using Mapbox GL JS. Map layers include building archetypes, carbon metrics, EUI, and Green Mark ratings. Each feature represents a single building with attributes such as building levels, height, footprint, gross floor area, archetype, energy use, and carbon metrics.
Archetypes
- International & Local Frameworks: TABULA (EU), DOE Prototype Buildings (US).
- Singapore References: BCA codes, Green Mark dataset, HDB flat types dataset, URA development controls dataset, dwelling classifications.
Energy Simulation
- UBEM Guides: Introduction and setup instructions for urban-scale energy modeling.
- ASHRAE Guidelines: Parameters and procedures for building geometry setup.
- Singapore Standards: Codes for lighting, HVAC, curtain walls, sustainable data centers, energy efficiency. BCA Building Energy Benchmarking Report 2023, Refining Energy Benchmarks_IREUS
- Input Parameters: People density, occupancy schedules, energy and operational characteristics. Google’s public data
- Operational Data: Building EUI, energy consumption profiles, processed occupancy schedules. https://www.openelectricitymarket.sg
- Weather Data: TMY files (current, medium, long-term) and HWY files for extreme heatwave scenarios. https://annex80.iea-ebc.org/weather-data
Embodied Carbon Simulation
- Material Quantities: kg/m² of GFA, categorized by archetype-material. PDFs fitted for sufficient data; mean values used otherwise.
- Country of Origin: All materials assumed imported. UN Comtrade data used to determine probabilities of origin.
- A1-A3 Emissions: ECFs (kgCO₂e/kg) for extraction and manufacturing, categorized by country-material. PDFs or means calculated.
- A4 Transport Emissions: Sea freight distances × transport ECFs to obtain emissions.
- A5 Waste & Onsite Emissions: Industry-average waste factors and onsite construction emissions, fitted to PDFs where data allows.
- Standards & Guidelines: Incorporates RICS, GBCA, SGBC, NZGBC, URA, BCA; includes URA Development Control, HDB flat types, Green Mark, and Buildability codes.
Mapping Data Dictionary
| Features Name | Dataset Field Name | Description | Data Type | Data Source |
|---|---|---|---|---|
| Building ID | id | Unique identifier for each building, formatted as 'relation/' or 'way/' followed by a 7-digit number. | Text | OpenStreetMap |
| Building Name | addr_housename | Official name of the building, which may sometimes match its address. | Text | OpenStreetMap/BCA |
| Building Address (Housenumber) | addr_housenumber | Building's street or unit number, usually appearing before the street name in the full address. | Text | OpenStreetMap/BCA |
| Building Address (Street) | addr_street | Official street or road name where the building is situated. | Text | OpenStreetMap/BCA |
| Postal Code | addr_postcode | Singapore postal code assigned to the building location. | Text | OpenStreetMap/BCA |
| Building Levels | building_levels | Total number of above-ground floors in the building, excluding basement levels. | Text | OpenStreetMap/HDB*/Google Map |
| Building Archetype | building_archetype | Classification category from the 23 defined building archetypes, spanning both residential and non-residential uses. | Text | OpenStreetMap/HDB*/BCA/Machine Learning |
| Machine Learning Predicted Archetype Probability | ml_probability | The probability that a building belongs to a specific archetype, as predicted by a random forest classification model, based on input data from buildings in Singapore with known archetypes. | Number | Machine Learning |
| Height | height | Total vertical height of the building in meters, measured from ground level to the highest point. | Number | OpenStreetMap/HDB* |
| Building Footprint | building_footprint | Ground-level area covered by the building, calculated from its geometric polygon outline (m²). | Number | OpenStreetMap |
| Gross Floor Area | gross_floor_area | Total usable floor space in the building (m²), calculated or estimated based on footprint and number of floors. | Number | BCA/OpenStreetMap |
| Built Year | built_year | Year of the building's original construction completion. | Text | HDB*/OpenStreetMap/BCA |
| Data Source | data_source | Origin of the building data, with HDB and BCA sources specially marked for Mapbox layer filtering. Default: OpenStreetMap. | Text | HDB*/BCA |
| Green Mark Rating | greenmark_rating | Building's sustainability performance rating under Singapore's Green Mark certification system. | Text | BCA |
| Green Mark Year of Award | greenmark_year | Year when the Green Mark certification was granted to the building. | Text | BCA |
| Green Mark Version | greenmark_version | Specific edition of the Green Mark assessment criteria used for the building's certification. | Text | BCA |
| AC Floor Area Percentage | aircon_area | Percentage of total floor area with air-conditioning, primarily relevant for non-residential buildings. | Number | BCA |
| Type of AC System | aircon_type | Specific air-conditioning technology deployed in the building (e.g., central, split, VRF). | Text | BCA |
| Average Monthly Building Occupancy Rate | occupancy | Average monthly occupant density measured in persons per square meter (P/sqm). | Number | BCA |
| 2021 EUI | eui2021 | Measured Energy Use Intensity for 2021, representing annual energy consumption per unit floor area (kWh/m²/year). | Number | BCA |
| 2022 EUI | eui2022 | Measured Energy Use Intensity (EUI) for 2022, representing annual energy consumption per unit floor area (kWh/m²/year). | Number | BCA |
| 2023 EUI | eui2023 | Measured Energy Use Intensity for 2023, representing annual energy consumption per unit floor area (kWh/m²/year). | Number | BCA |
| Total Dwelling Units | total_dwelling_units | Complete count of individual residential units within the building. | Number | HDB* |
| Total Embodied Carbon | embodied_carbon | Total carbon emissions associated with building materials and construction processes (kgCO₂). | Number | Simulation |
| Cooling Carbon | energy_cooling | Carbon emissions resulting from energy used for space cooling and air conditioning (kgCO₂). | Number | Simulation |
| Lighting Carbon | energy_lighting | Carbon emissions resulting from energy consumed for interior and exterior lighting (kgCO₂). | Number | Simulation |
| Equipment Carbon | energy_equipment | Carbon emissions from energy used by appliances, office equipment, and other electrical devices (kgCO₂). | Number | Simulation |
| Water Carbon | energy_water | Carbon emissions associated with energy used for water heating, pumping, and treatment systems (kgCO₂). | Number | Simulation |
| Total End Use | energy_total | Aggregate carbon emissions from all operational energy consumption categories (kgCO₂). | Number | Simulation |
| Geometry Type | type | GeoJSON geometry classification, typically "Polygon" for simple buildings or "MultiPolygon" for more complex structures. | Text | OpenStreetMap |
| Geometry Coordinates | coordinates | Ordered array of geographic coordinates defining the building outline, with each point represented as [longitude, latitude]. | Array | OpenStreetMap |
| Land Use ID | Name | Unique identifier assigned to each land parcel in the Master Plan | Text | URA |
| Land Use GPR | GPR | Maximum permissible gross plot ratio specified for the parcel | Number | URA |
| Land Use Description | LU_DESC | Official land use designation under the URA Master Plan 2019 (e.g., Residential, Commercial, Park) | Text | URA |
*Data for HDB buildings is derived from various data sources including HDB, OpenStreetMap, and the HDB dataset from the NUS Urban Analytics Lab.
Data Download
Energy Simulation Templates
| Archetype Name | Description | Download IDF | Download DesignBuilder |
|---|---|---|---|
| HDB PPVC | Prefabricated Pre-finished Volumetric Construction (PPVC) is a method of building that uses modular units, pre-built offsite and assembled onsite. This approach helps reduce construction time and enhances quality control. | IDF | DesignBuilder |
| HDB non-PPVC | Traditional method of construction used by the Housing and Development Board (HDB) without prefabricated units. It involves the use of concrete and steel to construct public housing units. | IDF | DesignBuilder |
| Landed property | Landed properties are individual houses that have their own plot of land. They include detached houses, semi-detached houses, and terraced houses, offering more space and privacy compared to high-rise flats. | IDF | DesignBuilder |
| Private apartment & condo | Private apartments and condominiums are residential buildings that are owned privately. They usually offer amenities such as swimming pools, gyms, and security, and can be found in both city-centre and suburban areas. | IDF | DesignBuilder |
| Shophouse | Shophouses are traditional buildings that combine both commercial and residential uses. They typically consist of a ground-floor retail space with living quarters above. | IDF | DesignBuilder |
| Hotel | Hotels are commercial establishments offering accommodations to travelers, with amenities such as room service, concierge, and recreational facilities. | IDF | DesignBuilder |
| Retail | Retail properties include spaces for selling goods directly to consumers, such as shopping malls, stores, and boutiques. | IDF | DesignBuilder |
| Mixed development | Mixed development properties are those that combine different types of uses, typically commercial, retail, and residential, within a single complex. | IDF | DesignBuilder |
| Office | Office buildings are spaces designed for business and administrative purposes. They can range from small office buildings to large office towers. | IDF | DesignBuilder |
| Business park | Business parks are specialized areas designed to accommodate various types of businesses, particularly in research and development, information technology, and industrial services. | IDF | DesignBuilder |
| Hospital | Hospitals are large healthcare facilities that provide medical treatment and emergency care, with inpatient and outpatient services. | IDF | DesignBuilder |
| Clinic | Clinics are smaller healthcare facilities that offer outpatient medical services, typically for general practitioners or specialized services. | IDF | DesignBuilder |
| Nursing home | Nursing homes are facilities that provide residential care and support for elderly individuals, including medical assistance and daily living activities. | IDF | DesignBuilder |
| Inst. of higher learning (IHL) | Institutions of higher learning (IHL) include universities, polytechnics, and other higher education institutions offering advanced degrees and diplomas. | IDF | DesignBuilder |
| Non-IHL | Non-Institution of Higher Learning refers to other types of educational institutions, including schools and training centres that provide education at a pre-university or vocational level. | IDF | DesignBuilder |
| B1 | B1 industrial properties are those zoned for light industry or research and development activities. They often accommodate businesses that do not involve heavy manufacturing processes. | IDF | DesignBuilder |
| B2 | B2 industrial properties are those zoned for general industrial uses, including manufacturing and processing activities that may produce noise, pollution, or waste. | IDF | DesignBuilder |
| Data centre | Data centres are facilities used to house computer systems and associated components, such as telecommunications and storage systems, often with high levels of security and redundancy. | IDF | DesignBuilder |
| Civic, community & cultural inst. | Civic, community, and cultural institutions include public buildings that serve community and cultural purposes, such as libraries, museums, and community centres. | IDF | DesignBuilder |
| Sports & recreation | Sports and recreation properties include facilities such as sports complexes, stadiums, gyms, swimming pools, and recreational parks. | IDF | DesignBuilder |
| Restaurant | Restaurants are establishments that provide food and beverages to customers in exchange for money, typically served at tables in a dining setting. | IDF | DesignBuilder |
| Hawker centre | Hawker centres are open-air food courts where various food vendors sell affordable local dishes, providing an essential part of Singapore's food culture. | IDF | DesignBuilder |
| Supermarket | Supermarkets are large retail spaces that sell a wide variety of food, beverages, and household products, typically arranged in aisles. | IDF | DesignBuilder |
Map GeoJSON
Energy Simulation
Before Start
Before beginning your urban- to district-scale energy simulation, make sure you have all the necessary software, tools, and files ready. This preparation will help you efficiently set up your model, run simulations, and analyze results without interruptions.
Required Software
- Rhino3D
- Grasshopper and its plugins, including Ladybug and OpenStudio Plugin for Rhino
- OpenStudio
- EnergyPlus
- Python
Required Files
- Simulation templates (download from Buildings.sg or our GitHub repository)
- Weather files (EPW) for your study area
Optional Online Tools
Quick Start
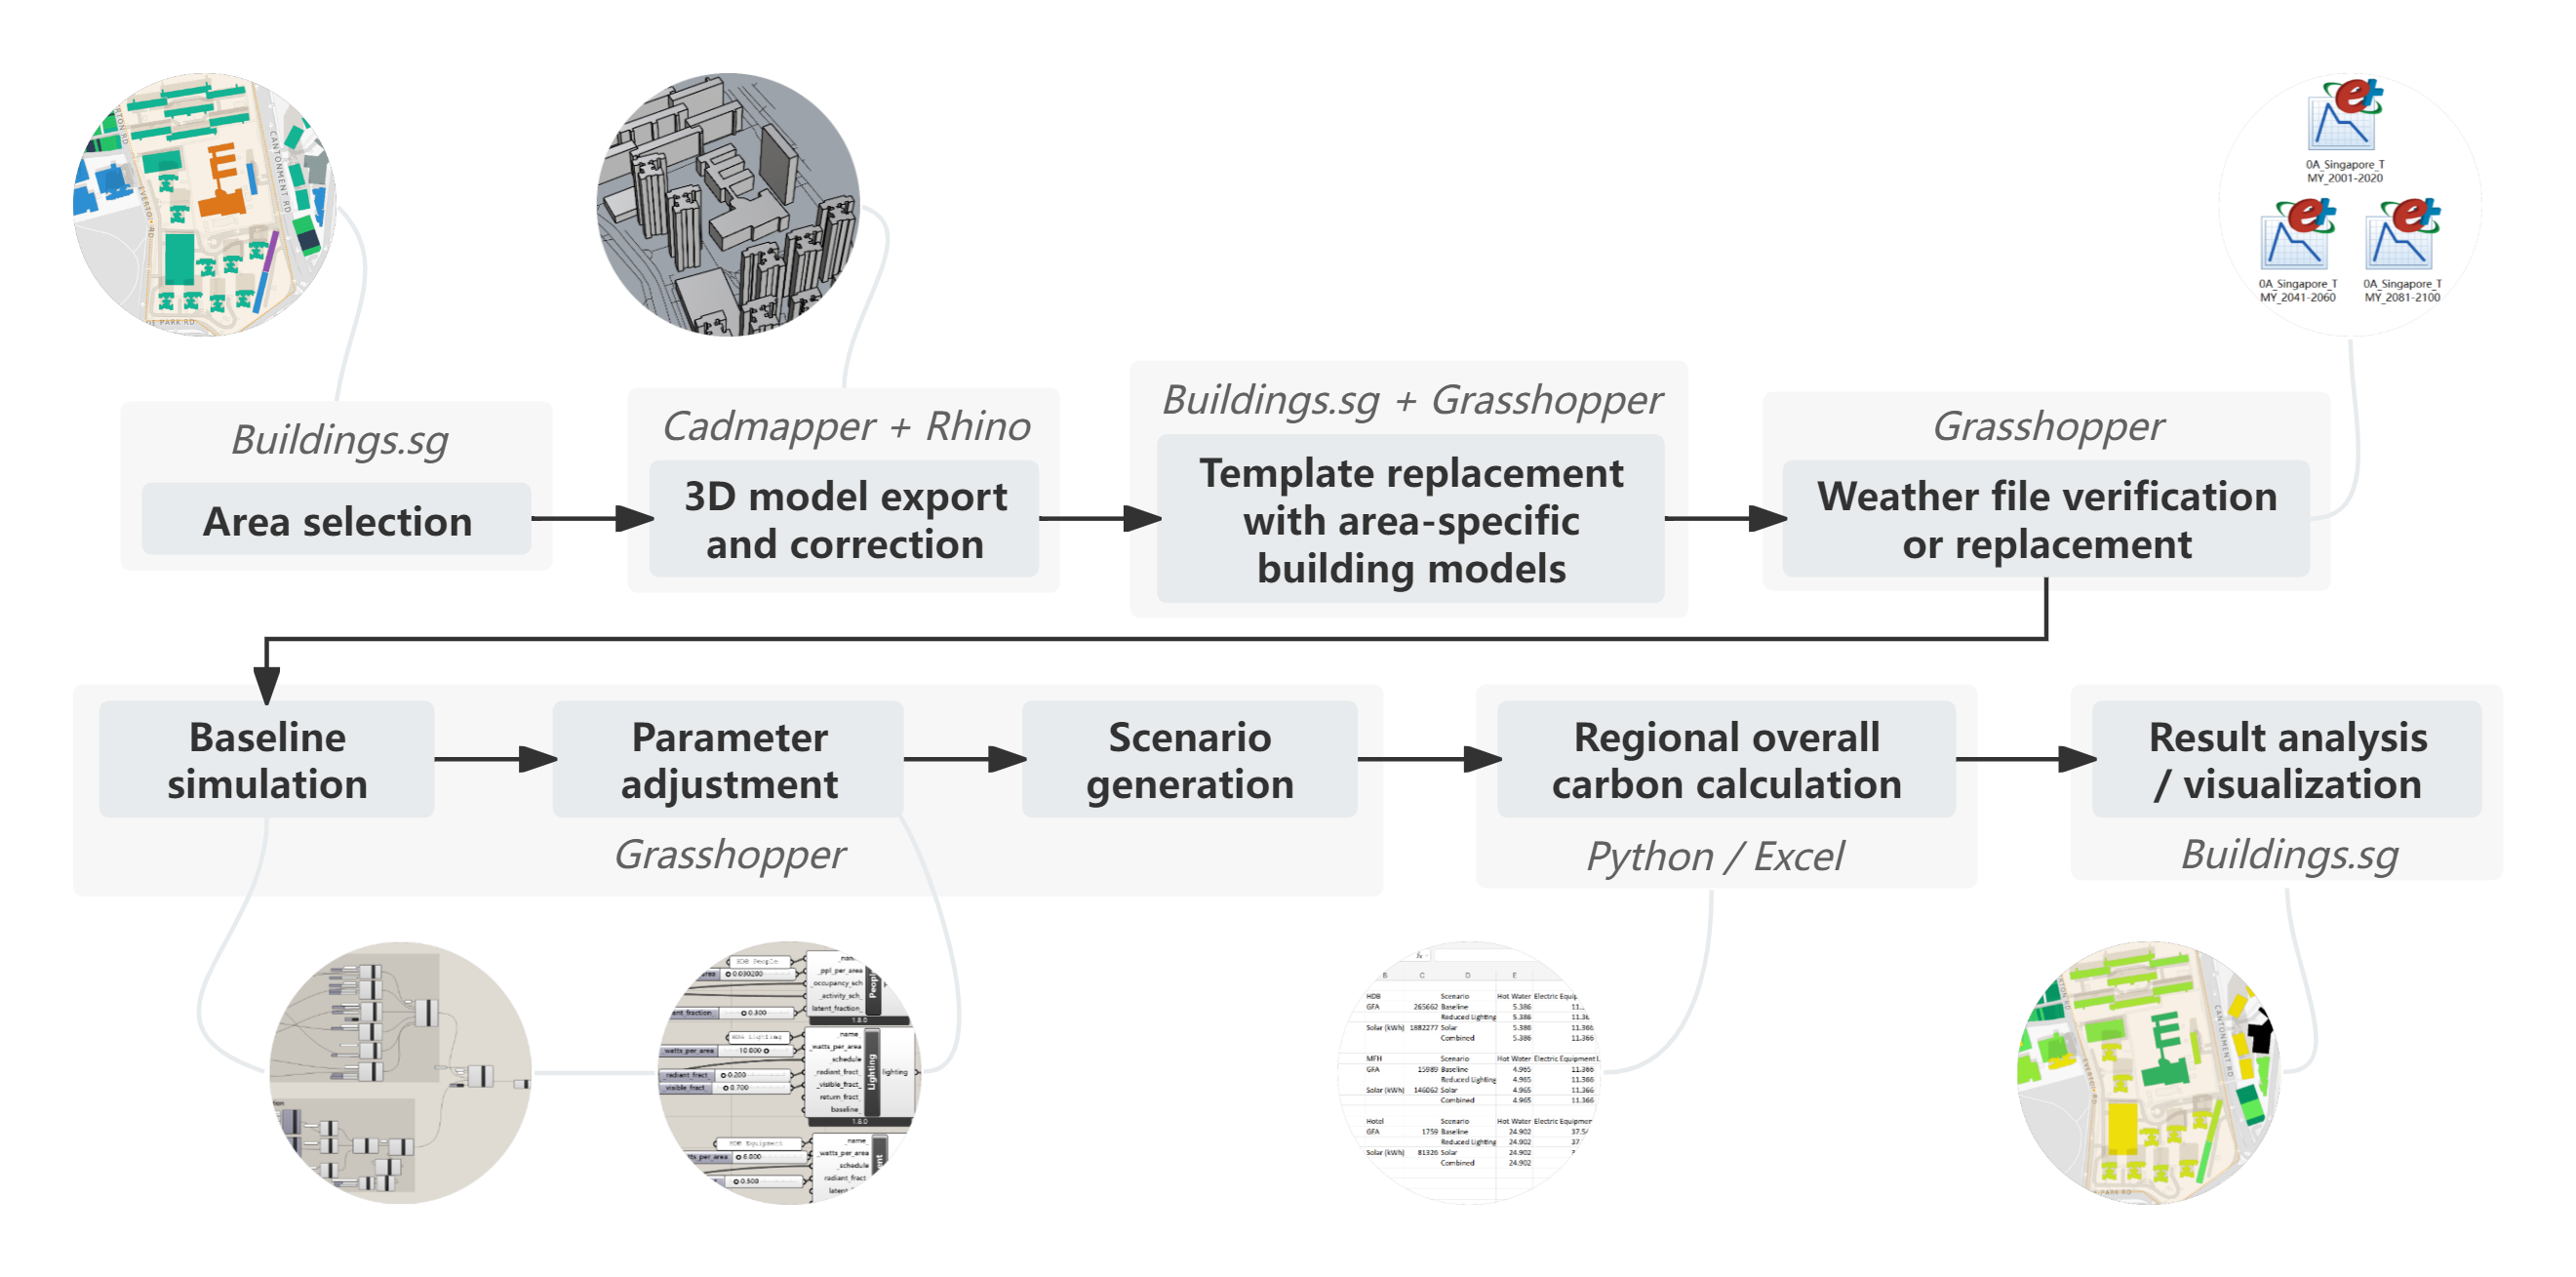
Step 1: Study Area Selection
Start by defining the area you want to study. This can be a single building, a block, a neighborhood, or a larger district. Identify the following information for all buildings in your study area:
- Number of buildings
- Function/type
- Number of floors/height
You can obtain this information from Buildings.sg (for Singapore) or other public sources such as Google Maps or OpenStreetMap.
Step 2: Geometry Export & Cleaning
If you already have a complete 3D model in Rhino3D, you can skip this step. Otherwise, follow these steps to obtain geometry data:
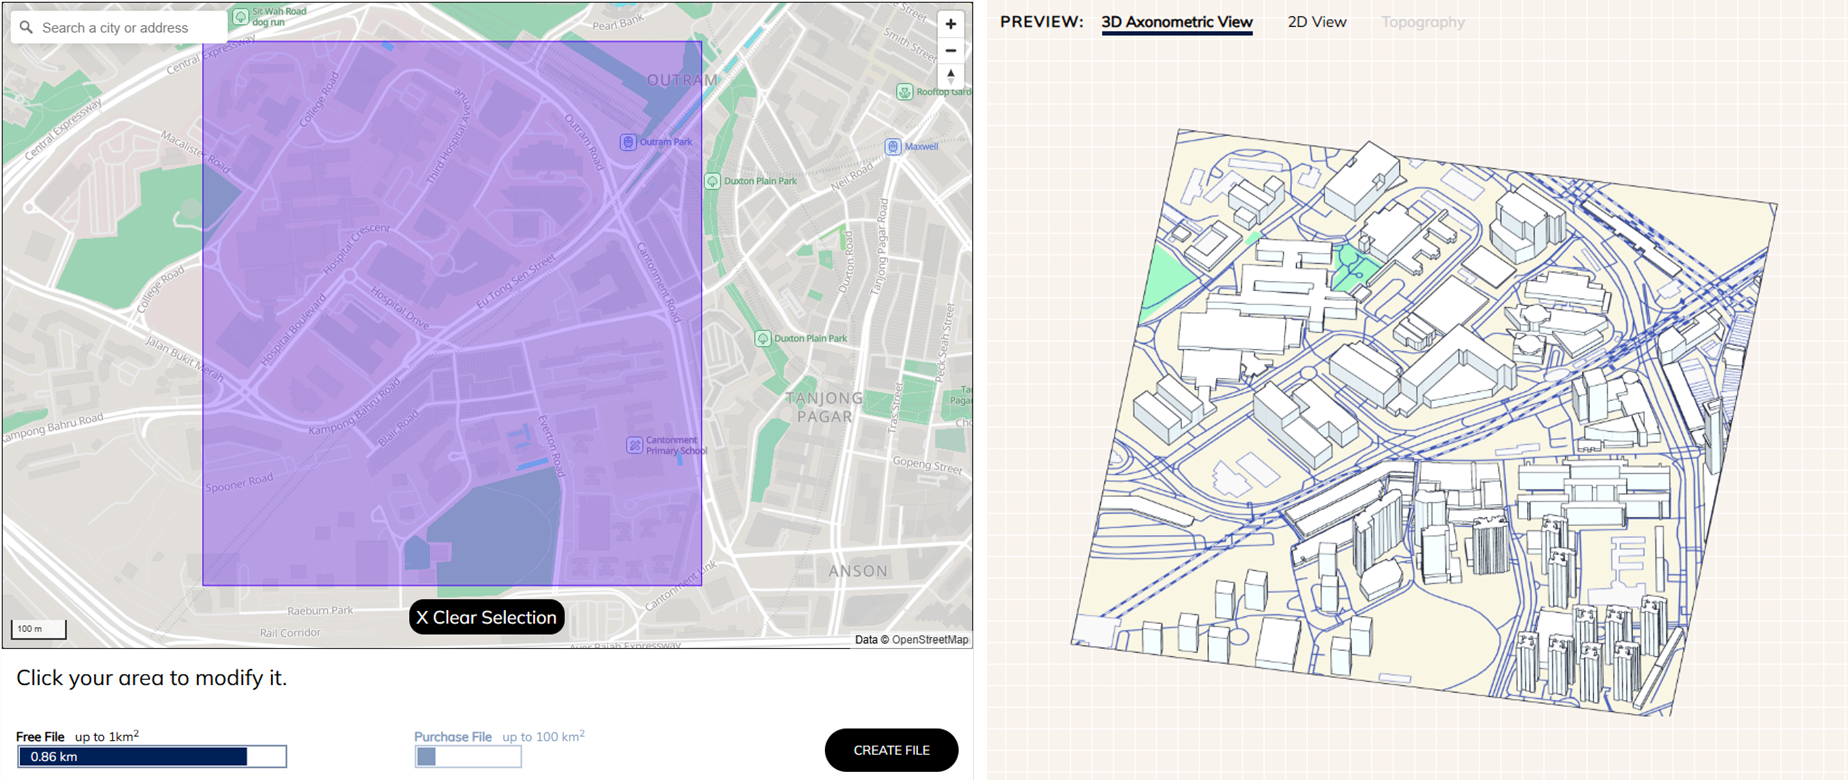
Example using Cadmapper:
- Enable Include 3D Buildings (if available).
- Draw a rectangle that fully encloses your study area and click CREATE FILE.
- Review the 3D Axonometric View on the right to ensure it is correct.
- Click DOWNLOAD to obtain your
.3dmmodel.
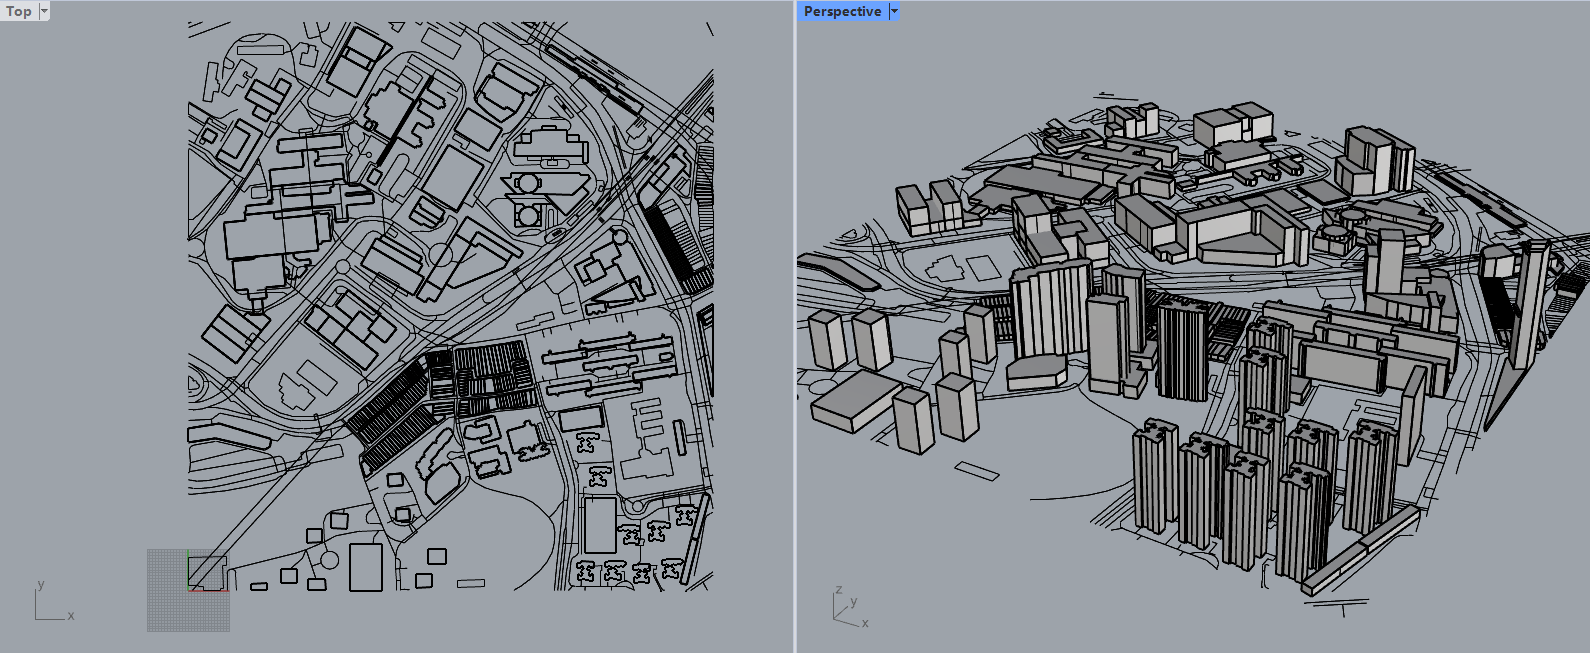
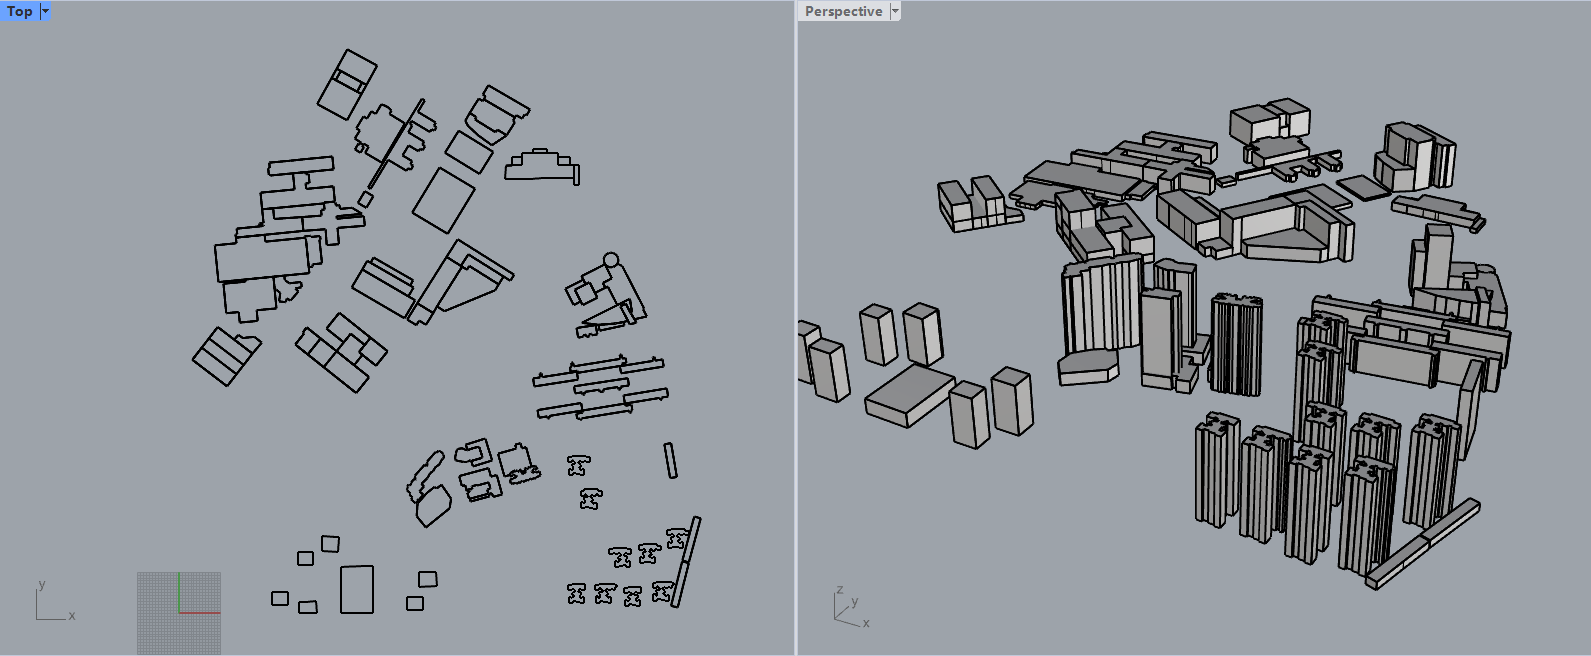
Step 3: Attribute Completion
Open your 3D model in Rhino and perform the following:
- Check all buildings for completeness and fix any duplicates or anomalies.
- Remove non-building objects (roads, green spaces, etc.) that are irrelevant to energy simulation.
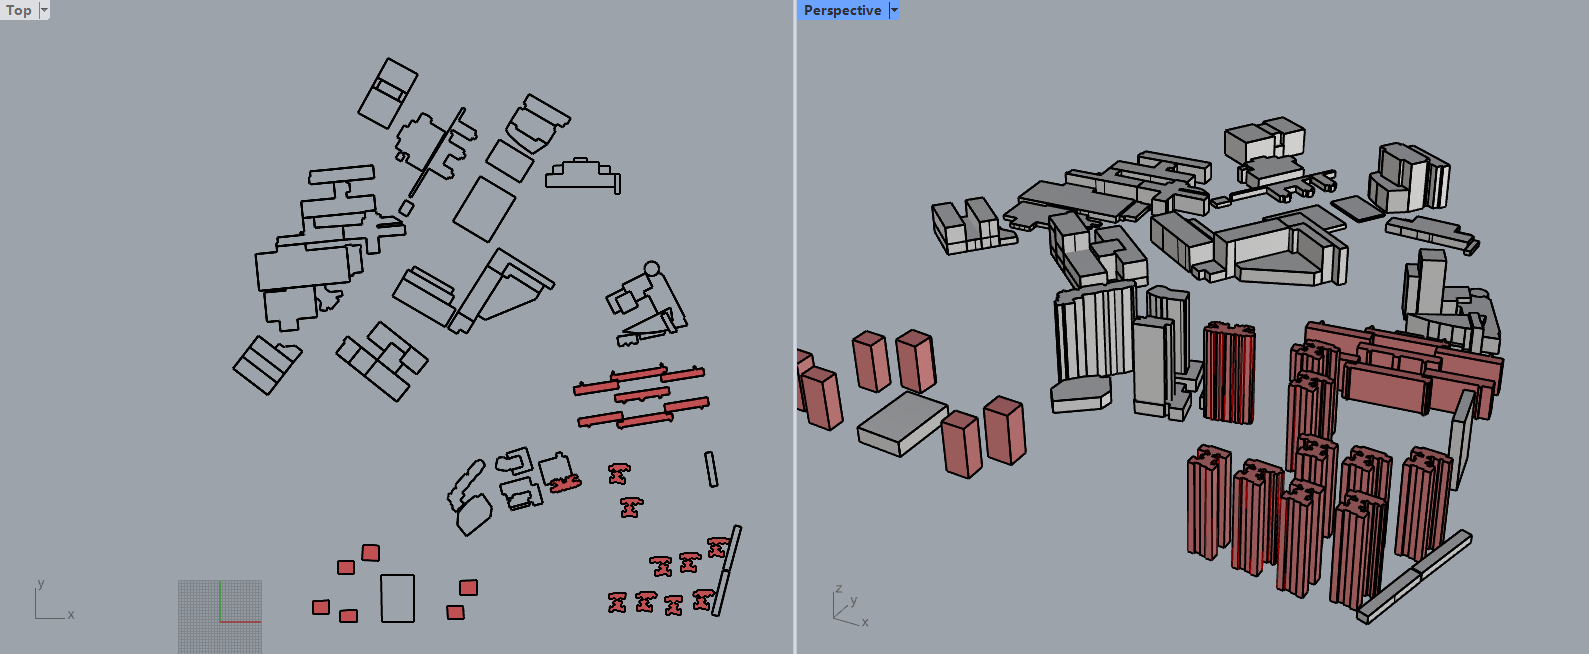
- Update building geometry with the correct height and function/type based on your research from Step 1. (You may need to manually adjust heights for individual buildings.)
Before and after this step:
Step 4: Simulation Template Setup
4.1 Install Plugins
Ensure Ladybug Tools / OpenStudio plugins are installed. Open Grasshopper in Rhino to confirm successful installation.
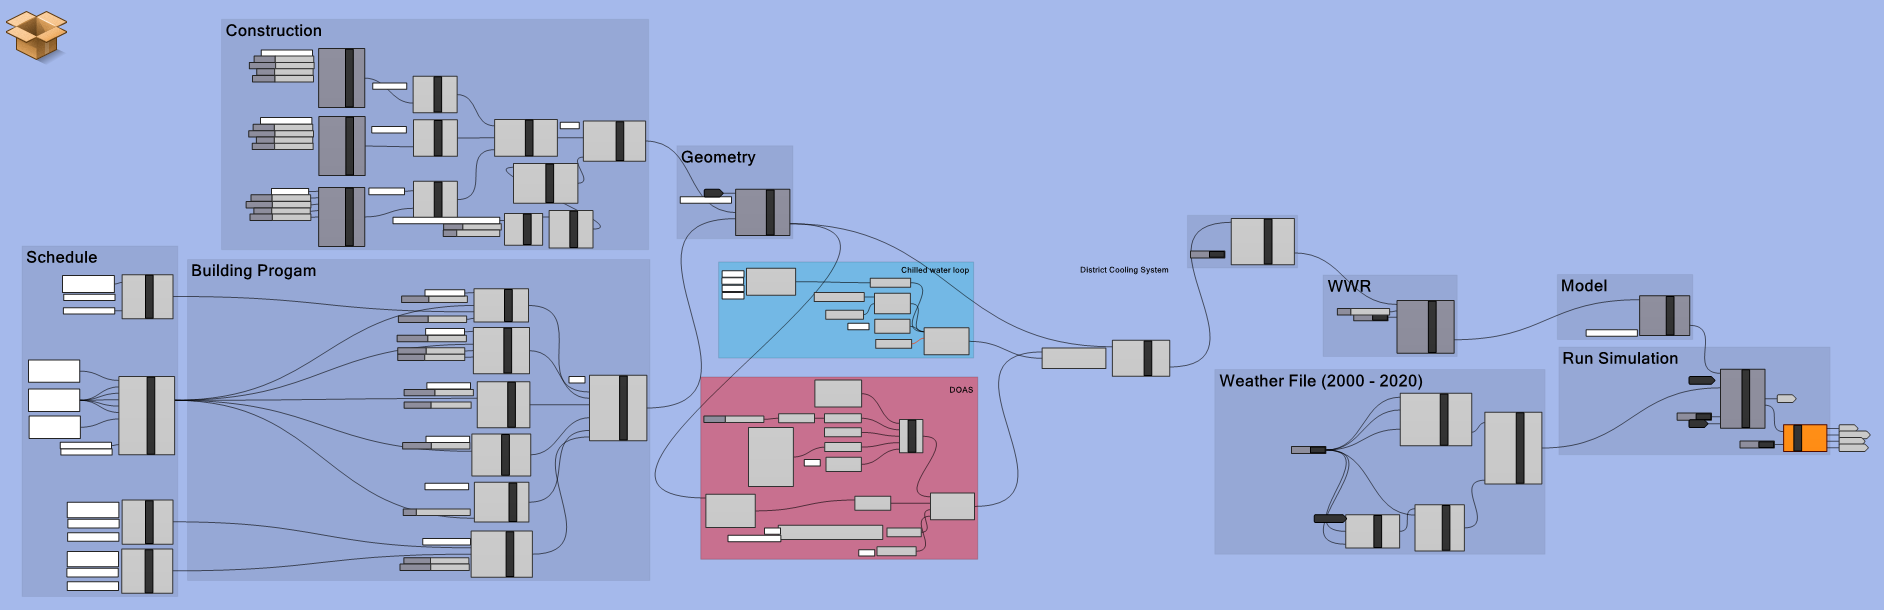
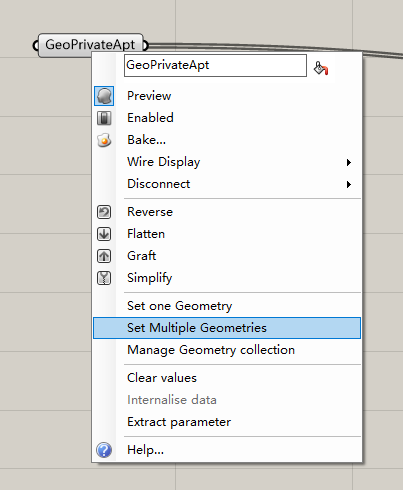
4.2 Import Archetype Template
Import the provided EnergySim_regional.gh file (containing all building archetypes) into
Grasshopper.
You can find the file at our GitHub repository
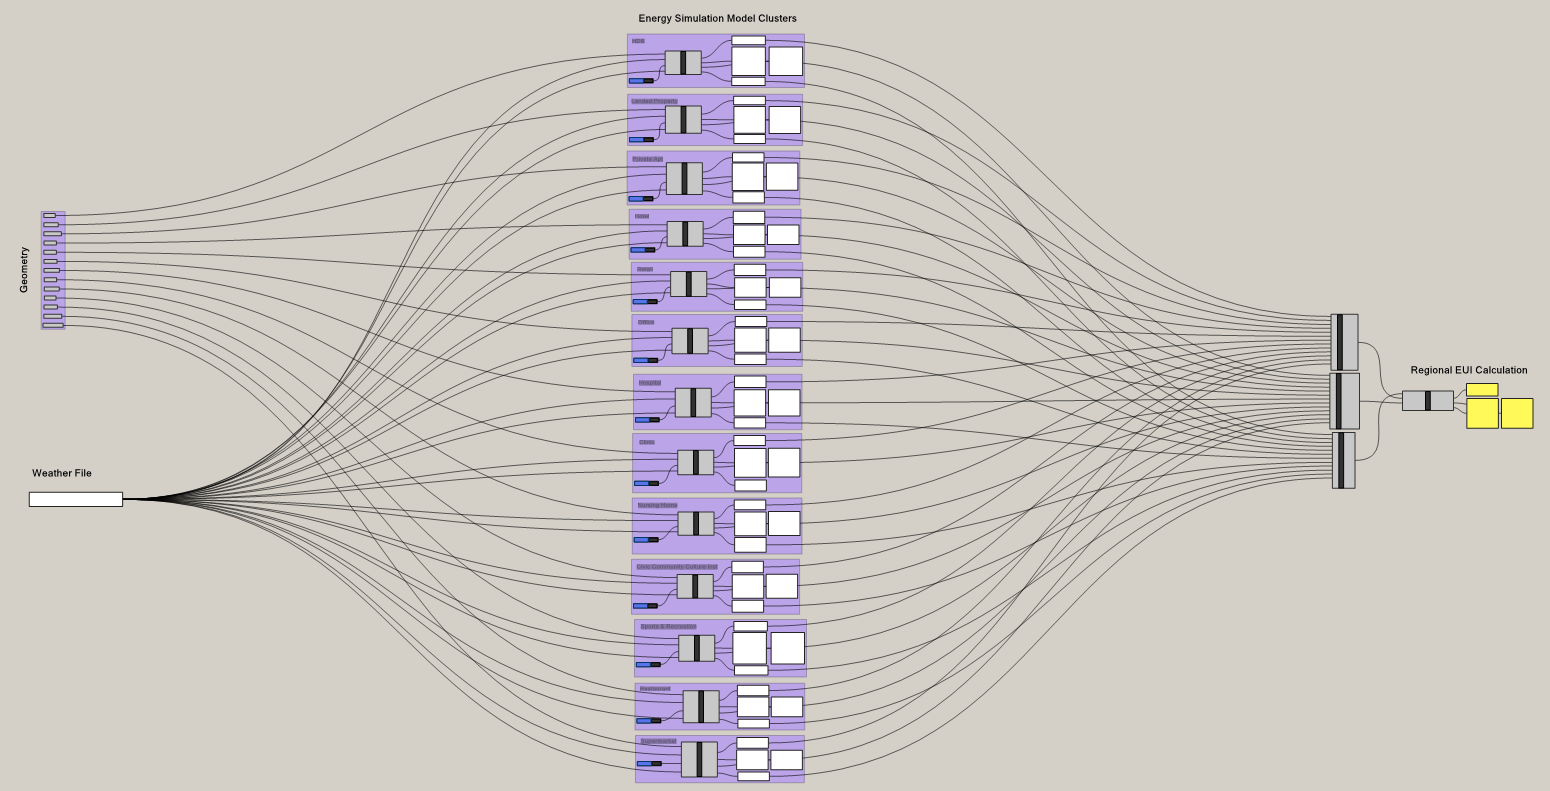
Each archetype as shown below.
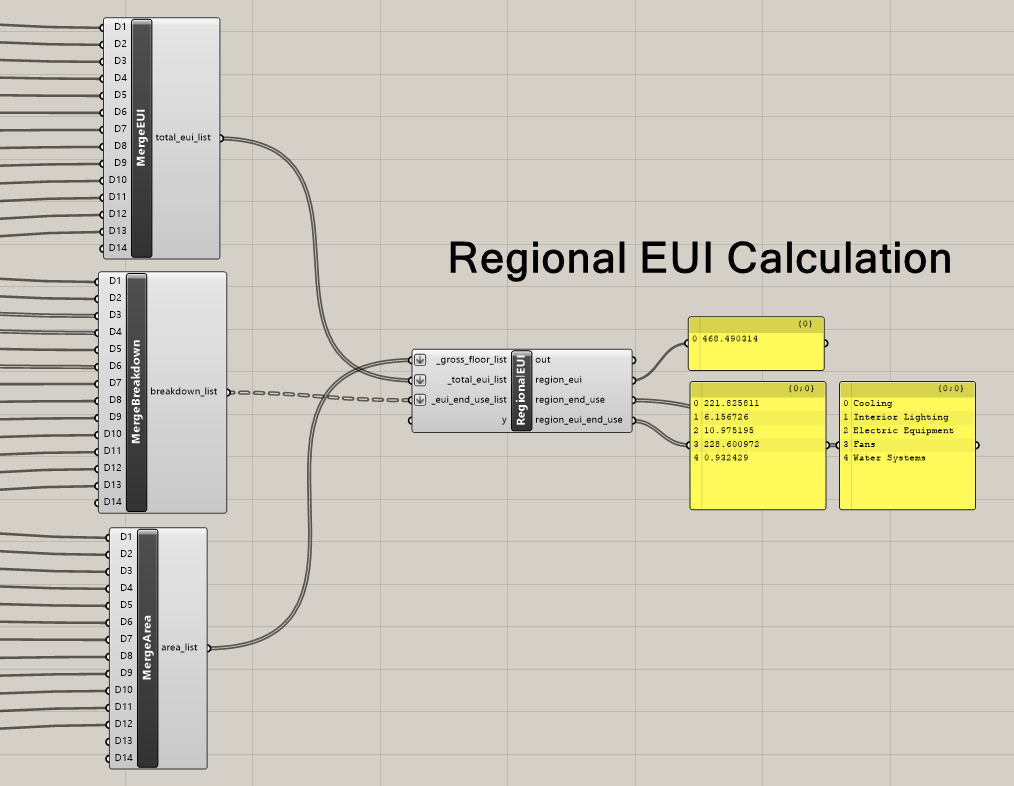
The internal structure of the EnergySimCluster is shown below.
Troubleshooting: If any components are red or display errors:
- Confirm that plugins from Step 4.1 are installed correctly.
- Check that OpenStudio is added to your system
PATH. - Ensure the template version is compatible; incompatible components can be replaced with the new ones.
4.3 Configure Weather & Geometry
- Replace the Weather File module with your own
.epwfile. - Right-click the Geometry module, select buildings corresponding to your study area by name, and press Enter. Selected buildings will appear red in Rhino.
4.4 Customize Input Parameters
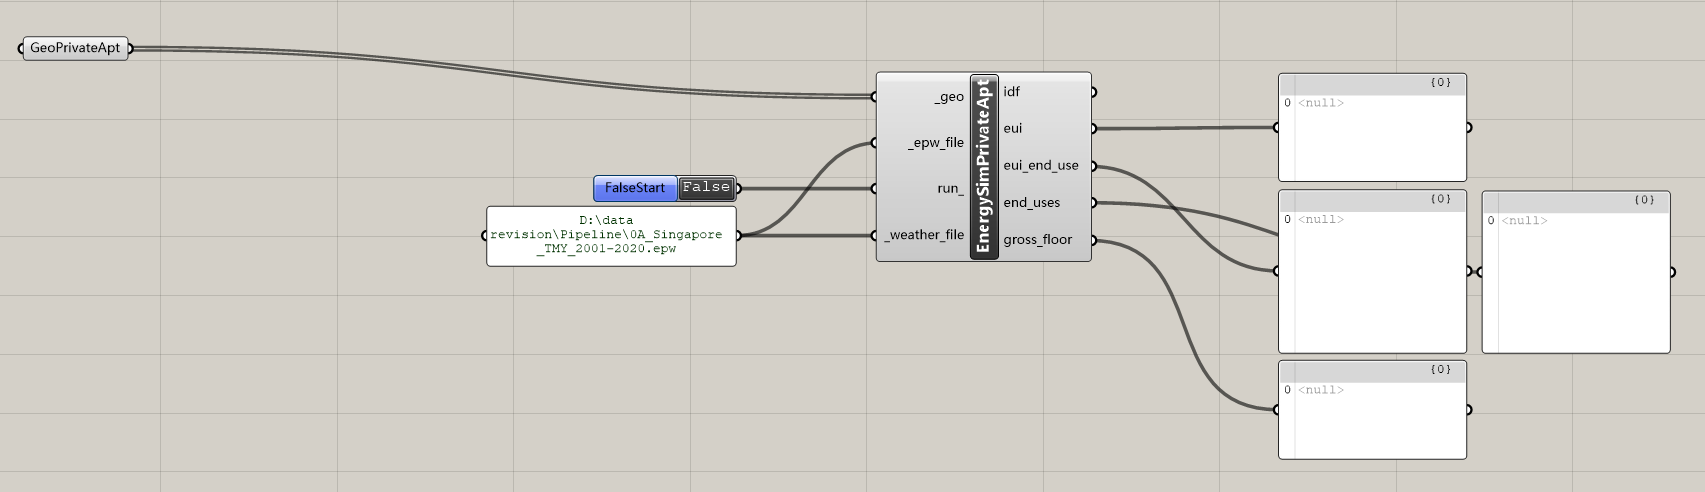
Double-click EnergySim Cluster to access internal input/output parameters. Modify inputs based on your data to generate a benchmark simulation.
4.5 Run Archetype Simulations
Double-click FalseStart under each archetype to start the simulation. Results for that archetype will appear in the panel to the right. Repeat for all archetypes. Calculate the overall district EUI by weighting individual archetype results.
Step 5: Scenario Setup & Batch Simulation
With the benchmark results obtained, you can perform scenario analysis:
- Modify inputs such as energy-efficient lighting, roof PV, advanced HVAC, wall insulation, or local occupancy schedules.
- Run simulations to generate district-scale results, including end-use breakdowns.
Notes:
- Total simulation time depends on building count and height.
- A typical sample area completes simulations within ~60 minutes, enabling rapid assessment of different energy-saving strategies.
Embodied Carbon Simulation
Before Start
Before running the probabilistic embodied carbon estimation for UBEM, make sure you have all the necessary software and tools ready. This preparation ensures smooth execution of the scripts and accurate generation of results.
Required Software for Code Execution
Software for District Modeling (Optional)
- Rhino3D (v8)
- Grasshopper (installed with Rhino)
- Anemone (v0.4)
Quick Start
Step 1: Prepare Data
Edit the Excel and CSV files in the /data subfolder as needed before running any scripts.
This
ensures that your embodied carbon calculation will use the most accurate and relevant inputs for your
study.
Step 2: Generate District-Independent Results
Run the following scripts in order to produce general EC results not tied to a specific district:
- EC_Calibration_A1A3ECF_Weights.py calibrates hyperparameters to meet the error threshold.
- EC_execution.py generates
archetype_containerobjects containing generalized EC results for each archetype; saves them as.pklfiles. - EC_results.py produces reports and diagrams in
.pkl,.xlsx, and.csvformats.
Step 3: Provide Study District Details
To generate results for a specific district, you need to provide:
- GFA of each building Use the Grasshopper script
district_modelling/Building GFA Calculator.ghor manually input data. Refer to the tutorialdistrict_modelling/Rhino & Grasshopper Tutorial.pptxfor guidance. - Archetype classification Assign each building to an archetype listed in
data/Available Archetypes.txt. - Input data Enter building GFAs and archetypes into
data/District Individual Building GFAs.xlsx.
Step 4: Generate District-Specific Results
After providing district details, run the following scripts:
- EC_district_execution.py calculates embodied carbon based on the district data and
saves
results as
.pklfiles. - EC_district_result.py generates district-level reports and diagrams for analysis.
Publication
Team
Yu Qian Ang: Principal Investigator, project coordination, and research guidance
Hongyao Wong: Data analysis and Energy Template modeling
Royden Soh Wei Jun: Data analysis and Embodied Carbon Template modeling
Pengdi LYu: Platform development, data analysis, and Energy Template modeling
Disclaimer
Data and results presented in Buildings.sg are for informational purposes only, and should not be used as the basis for legal, financial, or regulatory decisions. Despite our commitment to accuracy, we make no warranties regarding the precision, completeness, or reliability of this data. Users should independently verify all information through official sources before taking any action based on this platform. The developers, contributors, and affiliated organizations expressly disclaim all liability for any consequences arising from the use of this tool.